
Microsoft Power BI — See Your Business Clearly
Turn complex data into clear, interactive insights that drive faster and smarter decisions. By transforming raw datasets into intuitive dashboards and visualizations, it enables stakeholders to quickly understand trends, identify patterns, and take action with confidence.
Understanding Before Action

Data alone does not create business value—actionable insights do. TechAIVV helps organizations implement Microsoft Power BI to transform fragmented enterprise data into interactive, real-time business intelligence. By connecting multiple data sources and delivering intuitive visual analytics, Power BI empowers organizations to make faster, smarter, and more confident business decisions.
Instead of managing disconnected reports and spreadsheets, organizations gain a unified view of business performance through trusted dashboards, advanced analytics, and self-service reporting capabilities.
How Insights Come to Life
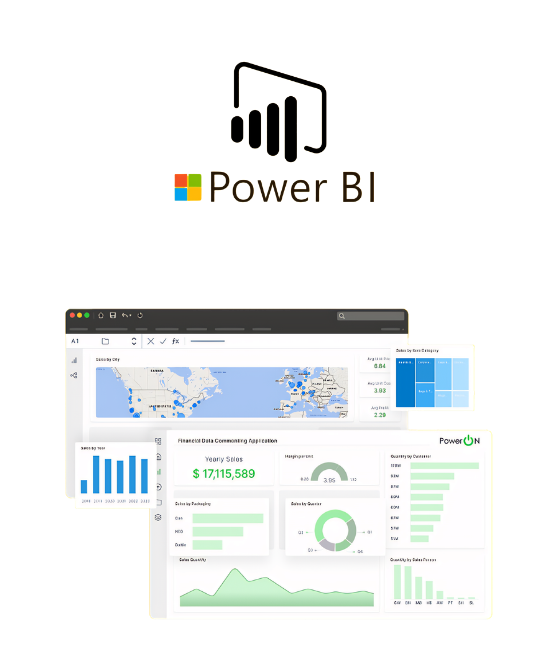
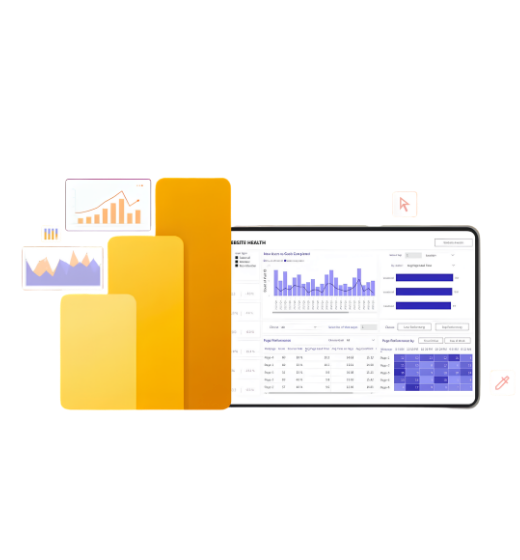
Self-Service Analytics for Everyone
Power BI enables business users to independently explore data, generate reports, and discover insights without relying heavily on technical teams. TechAIVV builds governed self-service analytics environments that balance user flexibility with enterprise security, consistency, and governance.
By democratizing access to trusted data, organizations foster a data-driven culture where business users can answer questions faster, collaborate more effectively, and make informed decisions with confidence.
Always Connected, Always Updated
TechAIVV implements Power BI environments that provide continuous access to trusted business information through real-time connectivity, automated refresh, and enterprise-grade security.
What It Unlocks for Your Business
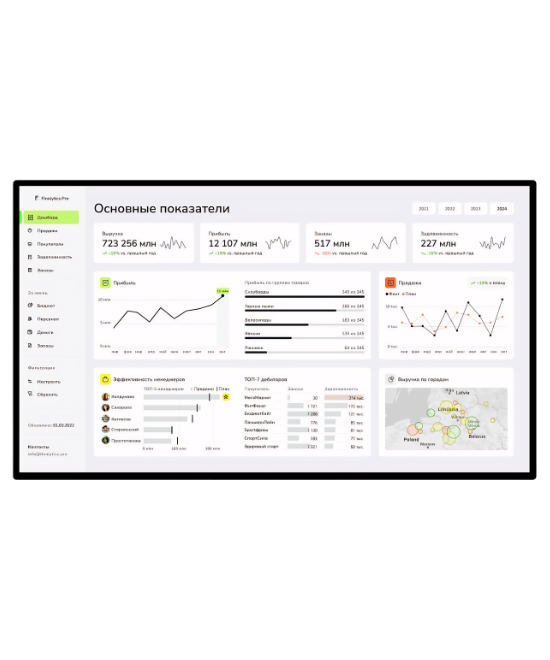
Power BI transforms enterprise data into actionable intelligence that improves operational visibility, strategic planning, and organizational performance.

From Raw Numbers to Business Stories
TechAIVV designs Power BI solutions that deliver more than dashboards—they create intelligent business experiences that connect enterprise data with strategic decision-making.
Our approach begins by understanding business objectives, decision workflows, stakeholder requirements, and key performance indicators. We then design scalable data models, establish trusted governance frameworks, and develop intuitive visualizations that guide users from executive summaries to detailed operational analysis.
By combining interactive dashboards, drill-through reporting, real-time analytics, and governed self-service capabilities, we enable organizations to build a modern business intelligence layer that improves collaboration, accelerates decision-making, and delivers measurable business value.
Frequently Asked Questions
What is Microsoft Power BI used for?
By connecting to multiple data sources, Power BI provides a unified view of business performance. It supports both real-time and historical analysis, making it suitable for operational and strategic use cases. This makes it a critical tool for modern business intelligence.
Can Power BI show real-time data?
Its intuitive interface allows users to explore data, filter insights, and generate reports without needing technical expertise. This promotes self-service analytics and reduces dependency on centralized teams.
Does it require coding knowledge?
This is particularly useful for tracking operational data, sales performance, and time-sensitive KPIs. With real-time updates, decision-makers can respond quickly to changes and take immediate action.
Is Power BI only for analysts?
However, advanced users can leverage tools like DAX and Power Query for complex data transformations and calculations. This flexibility makes it suitable for both beginners and experienced professionals.
Can it connect to different data sources?
This allows organizations to bring all their data into a single platform for analysis. Seamless integration ensures consistent and accurate insights across multiple systems.
Is Power BI cloud-based?
This flexibility allows businesses to choose deployment models based on their needs while maintaining control over data.
Can dashboards be customized?
Customization ensures that stakeholders see relevant insights tailored to their roles, improving decision-making efficiency.
Do you offer Power BI services?
We help design scalable data models, create intuitive dashboards, and ensure consistent data governance. Continuous optimization ensures your Power BI environment delivers long-term value.
Let’s Collaborate with Us!
From an early stage start-up’s growth strategies to helping existing businesses, we have done it all! The results speak for themselves. Our services work.