Tableu

WHAT WE BUILD

Tableau-Powered Analytics Systems

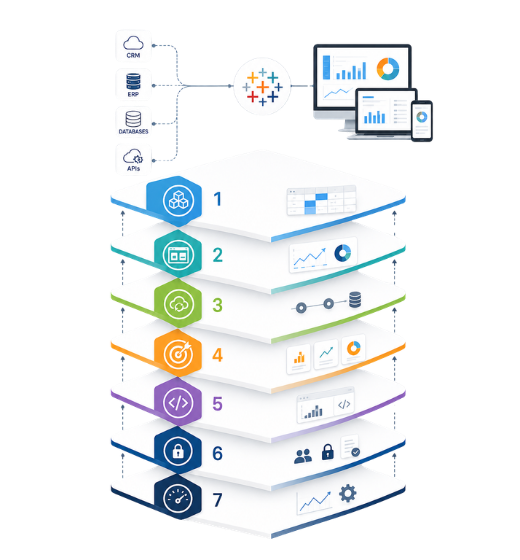
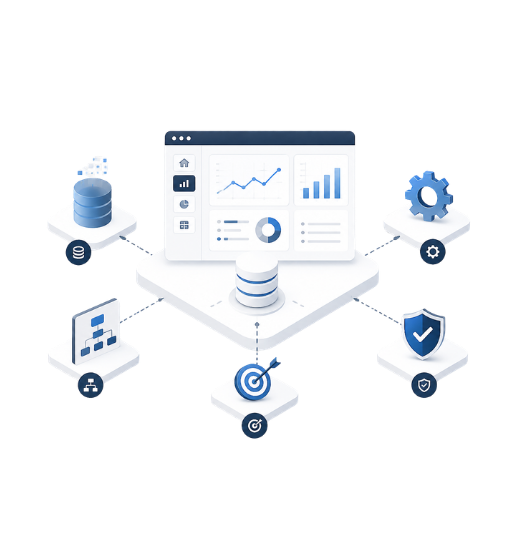
We don’t just build dashboards—we design analytics architecture using Tableau:

  • Visualization Layer — interactive dashboards with contextual insights
  • Real-Time Data Integration — live connections and automated refresh pipelines
  • KPI Frameworks — standardized metrics across teams
  • Embedded Analytics — integrate dashboards into applications and workflows
  • Data Governance Layer — centralized data definitions, access control
  • Data Modeling Layer — structured datasets aligned with business logic
  • Performance Optimization Layer — query tuning, extract strategies
THE REAL PROBLEM

Why Most Dashboards Fail

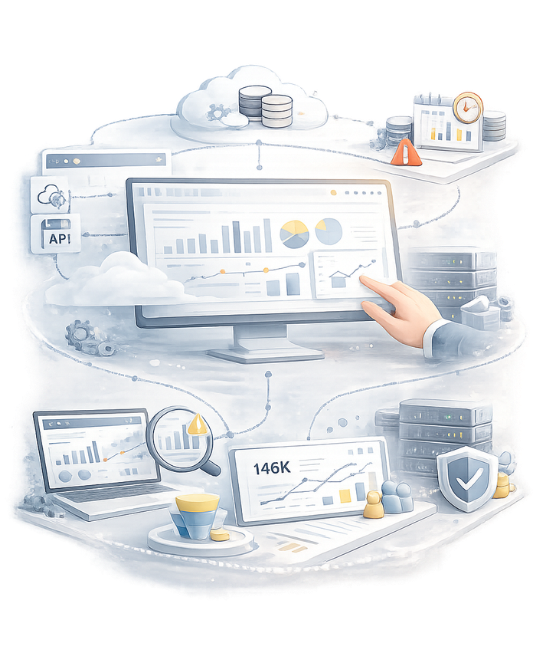
  • Data is fragmented across multiple systems, creating inconsistent reporting .
  • Metrics are often defined differently across teams, leading to business misalignment .
  • Manual reporting processes reduce operational agility and impact real-time visibility.
  • Without unified analytics and standardized data, dashboards remain static instead of actionable.
HOW IT WORKS

From Data to Decision

  • Connect data from multiple systems 
  • Clean and transform data for consistency
  • Build structured data models
  • Design interactive dashboards
  • Deliver insights aligned with business decisions
  • Standardize KPI definitions across teams for consistent reporting
  • Implement data validation and quality checks to ensure accuracy
  • Optimize data pipelines for performance and real-time updates
  • Enable role-based access control and data security
  • Embed dashboards into operational workflows.
ANALYTICS CAPABILITIES

What Tableau Enables

Unified data access across cloud, on-prem, and APIs
Real-time + scheduled insights without manual reporting
Real-time + scheduled insights without manual reportings
Interactive exploration with drill-down, filters, and actions
Consistent KPI tracking across teams and departments
Scalable dashboards that handle growing data volumes
Secure data access with role-based and row-level controls
USE CASES

Where Tableau Drives Impact

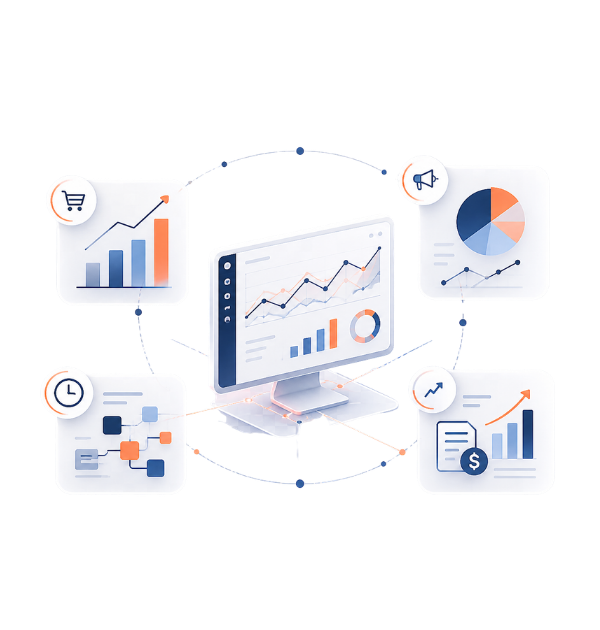
These use cases demonstrate how Tableau transforms raw data into actionable insights across key business functions. By connecting multiple data sources and standardizing metrics, organizations gain real-time visibility into performance, enabling faster and more informed decision-making.

Sales & Revenue Analytics — pipeline visibility, conversion tracking
Marketing Analytics — campaign performance, attribution insights
Operational Dashboards — real-time system and process monitoring
Financial Reporting — forecasting, cost analysis, profitability insights

TECHNICAL CAPABILITIES

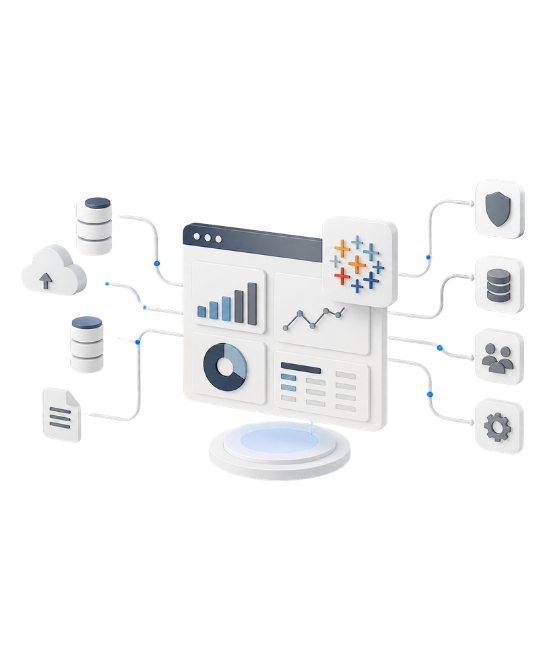
These capabilities enable Tableau to function as a robust analytics layer that connects, processes, and secures data across systems. Instead of just visualizing information, it provides controlled, high-performance access to data, ensuring accuracy, scalability, and governed usage across the organization.

Live and extract-based data connections
Advanced calculated fields and LOD expressions
Data blending and multi-source integration
Performance optimization for large datasets
Role-based access and data security
Tableau becomes a data access layer, not just a visualization tool.
WHY TECHAIVV

We engineer analytics systems that drive decisions

At TechAIVV, we go beyond building dashboards to engineering complete analytics systems that drive real business decisions. Our approach focuses on establishing strong data logic, structured data models, and standardized KPI frameworks, ensuring consistency across your organization. Instead of delivering isolated reports, we design decision-driven analytics that integrate seamlessly with your systems and workflows. The result is a scalable analytics layer that not only visualizes data but enables faster, accurate, and actionable decision-making across teams.

WHO IT’S FOR

Built for Data-Driven Organizations

This is for you if:
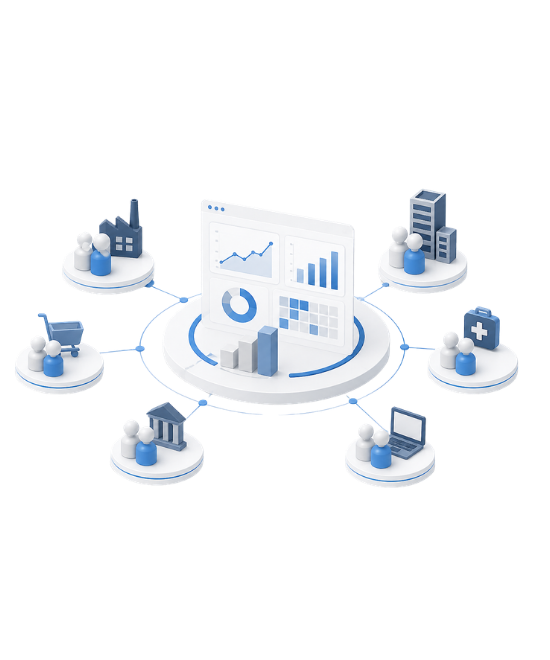
Your data is spread across multiple systems
Your reports are inconsistent across teams
Decision-making is delayed due to lack of insights
You need real-time analytics at scale
Your dashboards are not driving business actions

Frequently Asked Questions

What is Tableau and how does it fit into a modern data architecture?
Tableau is a business intelligence and data visualization platform that sits on top of your data ecosystem to transform raw data into interactive insights. In modern data architecture, Tableau acts as the presentation and analytics layer, connecting to data warehouses, data lakes, and operational systems. It enables users to explore data through dashboards while maintaining a structured connection to underlying data models. When implemented correctly, Tableau is not just a reporting tool—it becomes a critical component of a scalable analytics system that supports real-time decision-making.
How is your approach to Tableau different from standard dashboard development?
Standard Tableau implementations focus on creating visual dashboards based on available data. Our approach is system-driven, where we first define data models, KPI frameworks, and business logic before building any visualization. This ensures that dashboards are consistent, scalable, and aligned with decision-making processes. Instead of isolated reports, we create an integrated analytics layer where data flows, calculations, and metrics are standardized across the organization. This eliminates inconsistencies and ensures that every dashboard reflects the same source of truth.
Can Tableau handle real-time data and large datasets?
Yes, Tableau supports both live connections and extract-based models, allowing it to handle real-time and large-scale data efficiently. Live connections enable direct querying of data sources such as cloud warehouses and databases, while extracts optimize performance by storing data in-memory. For large datasets, we implement performance optimization strategies such as query optimization, aggregation, and efficient data modeling. This ensures that dashboards remain responsive even when dealing with high data volumes and complex queries.
How do you ensure data consistency across multiple dashboards and teams?
Data consistency is achieved through a centralized data modeling and governance approach. We define standardized data sources, reusable calculations, and KPI definitions that are shared across all dashboards. Tableau data sources are structured to act as a single source of truth, ensuring that all teams work with the same metrics and logic. This eliminates discrepancies between reports and ensures alignment across departments. Governance practices such as version control, access management, and documentation further reinforce consistency.
What are calculated fields and LOD expressions in Tableau?
Calculated fields in Tableau allow users to create custom metrics and transformations directly within the platform. Level of Detail (LOD) expressions are advanced calculations that enable analysis at different levels of granularity, independent of the visualization. For example, LOD expressions can calculate metrics at a fixed level, such as total revenue per customer, regardless of how the data is displayed. These capabilities allow for more complex and precise analytics, enabling deeper insights beyond basic aggregations.
How do you integrate Tableau with multiple data sources and systems?
Tableau can connect to a wide range of data sources, including databases, cloud platforms, APIs, and flat files. We design integration pipelines that ensure data from different systems is cleaned, transformed, and structured before being visualized. Data blending and joins are used to combine multiple datasets within Tableau, while ETL/ELT processes ensure data consistency at the source level. This allows organizations to create unified dashboards that reflect data from across their entire ecosystem.
How do you optimize Tableau performance for enterprise-scale usage?
Performance optimization involves multiple layers, including data modeling, query optimization, and dashboard design. We reduce data complexity by aggregating data where possible, optimize queries to minimize load times, and use extracts for faster processing. Dashboard design is also optimized by limiting unnecessary calculations and visual elements. Additionally, we implement caching, indexing, and efficient data source connections. This ensures that Tableau performs efficiently even at enterprise scale with large datasets and multiple users.
What outcomes can organizations expect from a well-implemented Tableau solution?
Yes, we provide end-to-end AWS services including architecture design, implementation, migration, optimization, and ongoing support. Our approach focuses on aligning AWS capabilities with your business goals to ensure performance, scalability, and cost efficiency.
We help design cloud-native systems, optimize workloads, and implement best practices for security and governance. Continuous monitoring and improvement ensure your AWS environment delivers long-term value.

Let’s Collaborate with Us!

From an early stage start-up’s growth strategies to helping existing businesses, we have done it all! The results speak for themselves. Our services work.